Monitor every endpoint,
network, and client from one console
Topplo unifies endpoint and SNMP network monitoring, automatic topology mapping, patching, automation, ticketing and multi-client management — so you can run all of your IT operations from a single pane of glass.
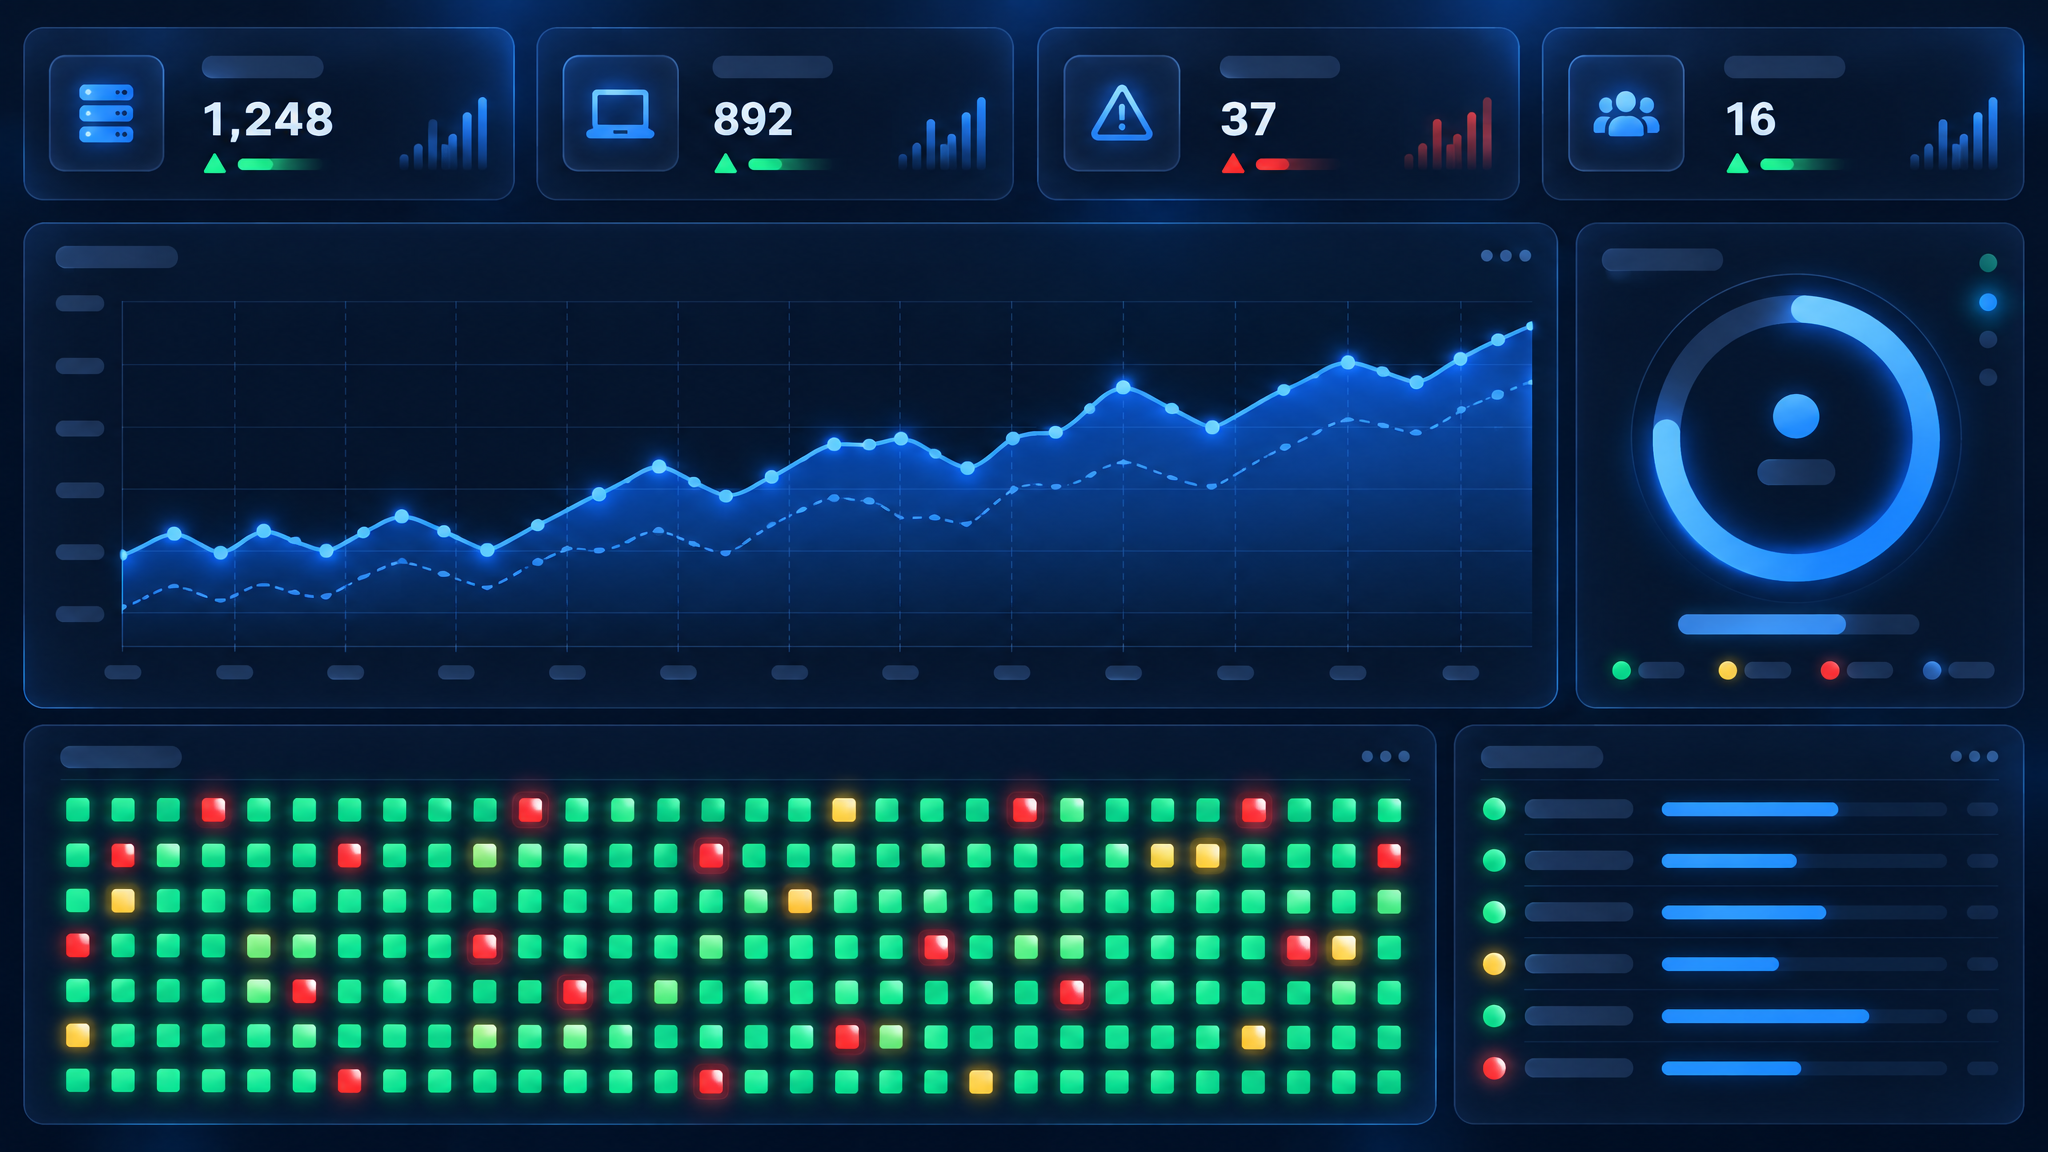
One platform for your entire stack
Stop stitching together point tools. Topplo brings monitoring, networking, patching and automation into a single, coherent workflow.
Real-time health
Live CPU, memory, disk and service metrics streamed from every agent.
Network visibility
Discover switches and routers over SNMP and watch interface-level throughput.
Automatic topology
A network map that builds itself — including chained switches and downstream devices.
Patch & compliance
Know what needs updating and push patches across the fleet.
Automation profiles
Schedule routine maintenance so it runs itself, on your terms.
Built for MSPs
Isolate every client, delegate with roles, and report per organization.
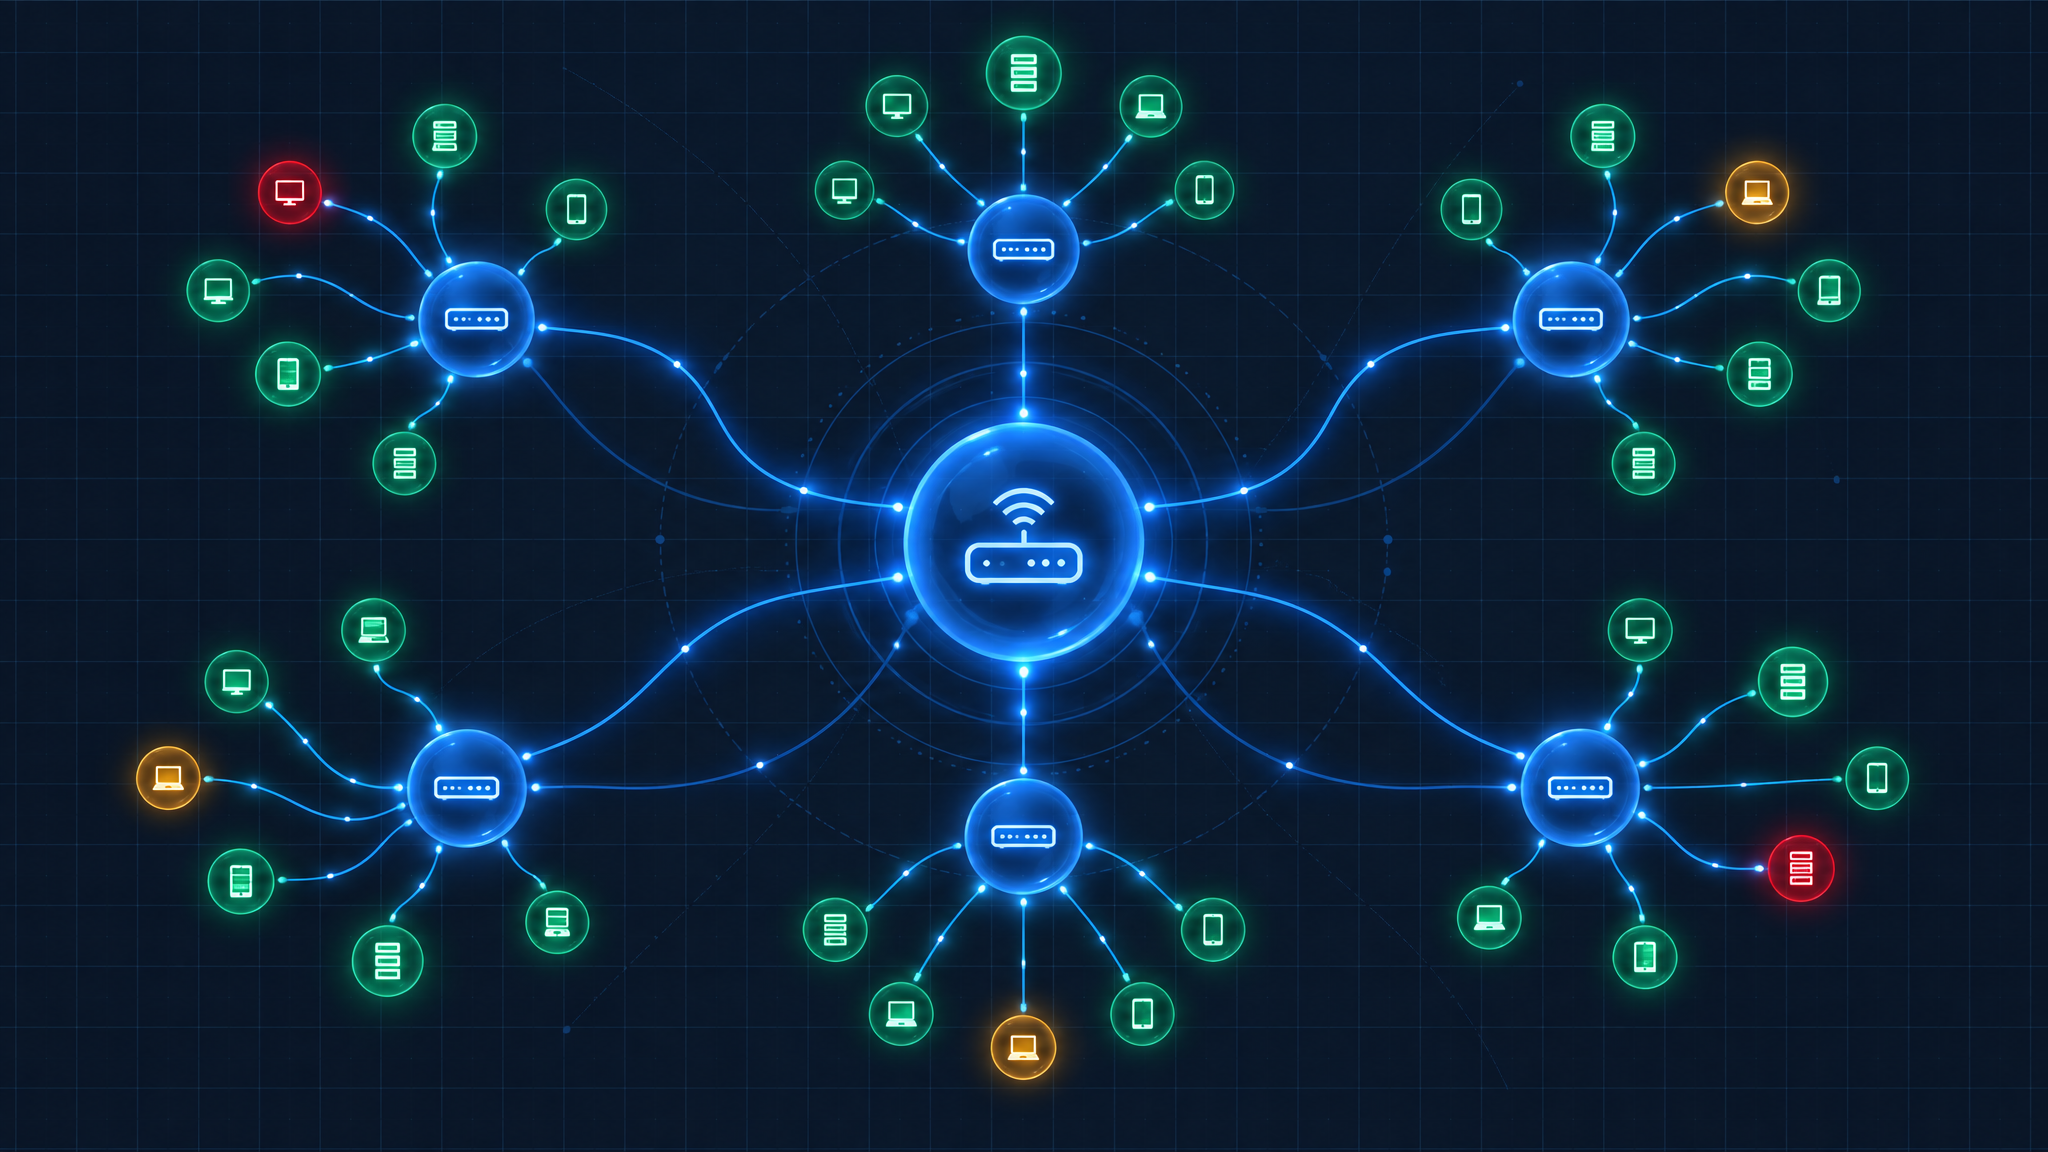
See your whole network, mapped automatically
Point Topplo at your infrastructure and it discovers switches, routers and firewalls over SNMP, then draws a live topology — including chained switches and the devices behind them.
- SNMP v1, v2c and v3 device discovery
- Per-interface throughput on live edges
- Chained-switch and downstream-device mapping
- A network map that stays current on its own
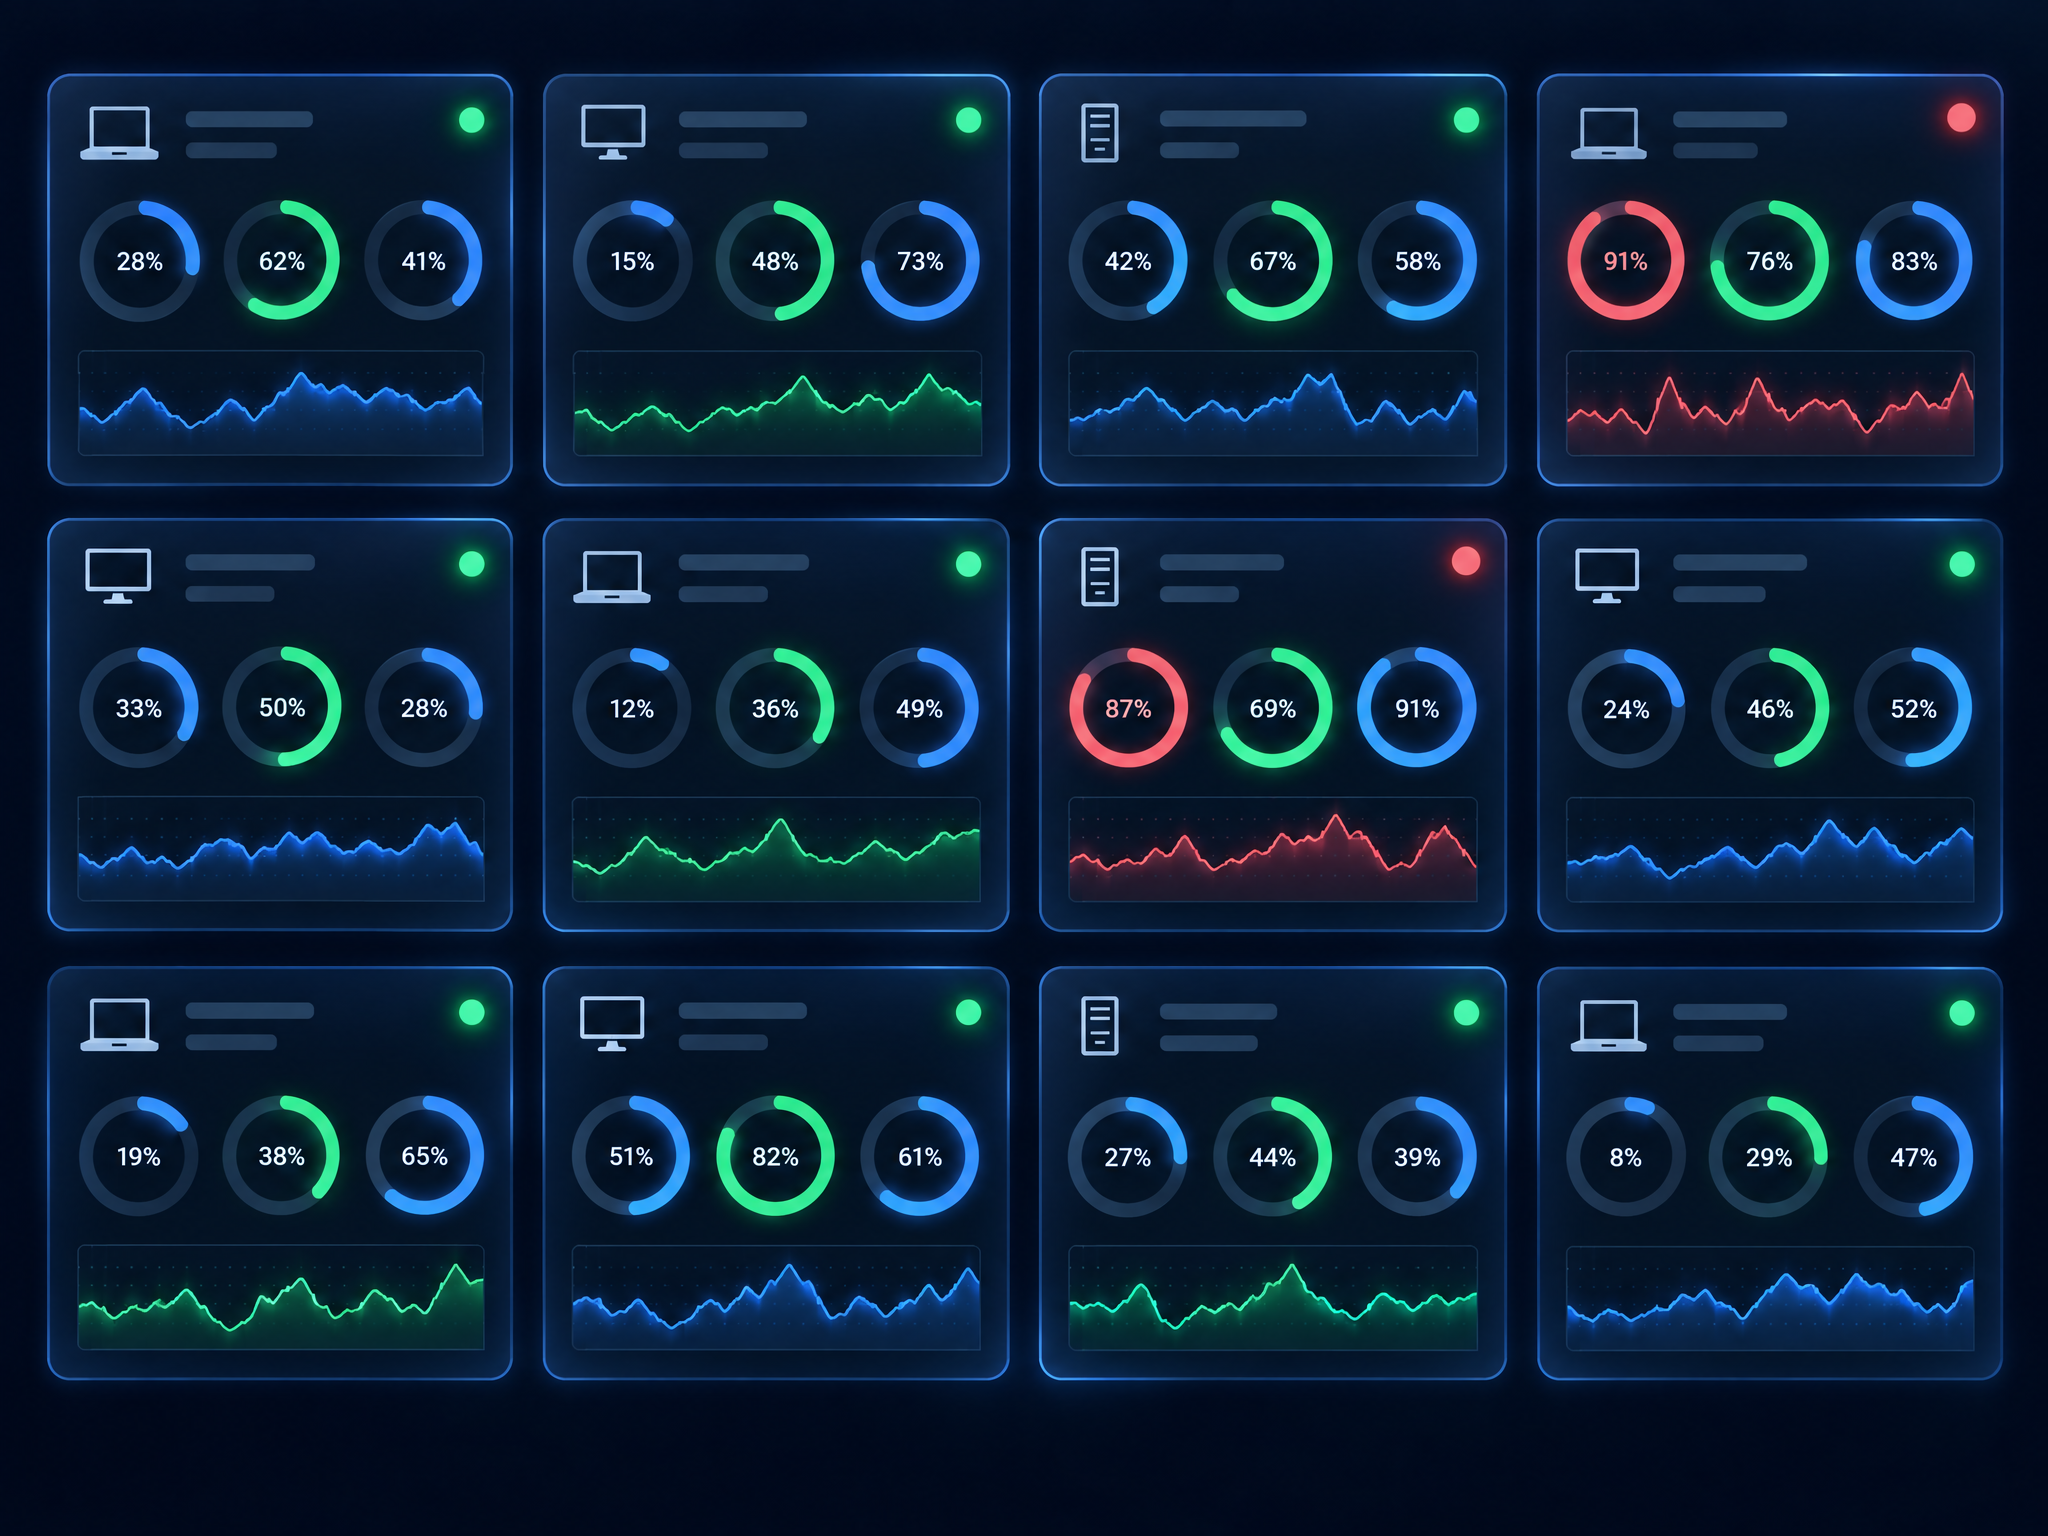
Deep visibility into every device
A lightweight agent reports the metrics that matter — utilization, running services, installed software and more — so you always know the real state of every machine.
- CPU, memory and disk utilization
- Service and software inventory
- Historical trends per device
- Windows, Linux and macOS support
Alerts that match how you actually work
Define the thresholds that matter, roll them up into fleet-wide health signals, and quiet the noise with cooldowns and maintenance windows so real issues never get buried.
- Threshold-based alert rules per metric
- Fleet health roll-ups across clients
- Cooldowns to suppress repeat noise
- Maintenance windows for planned work

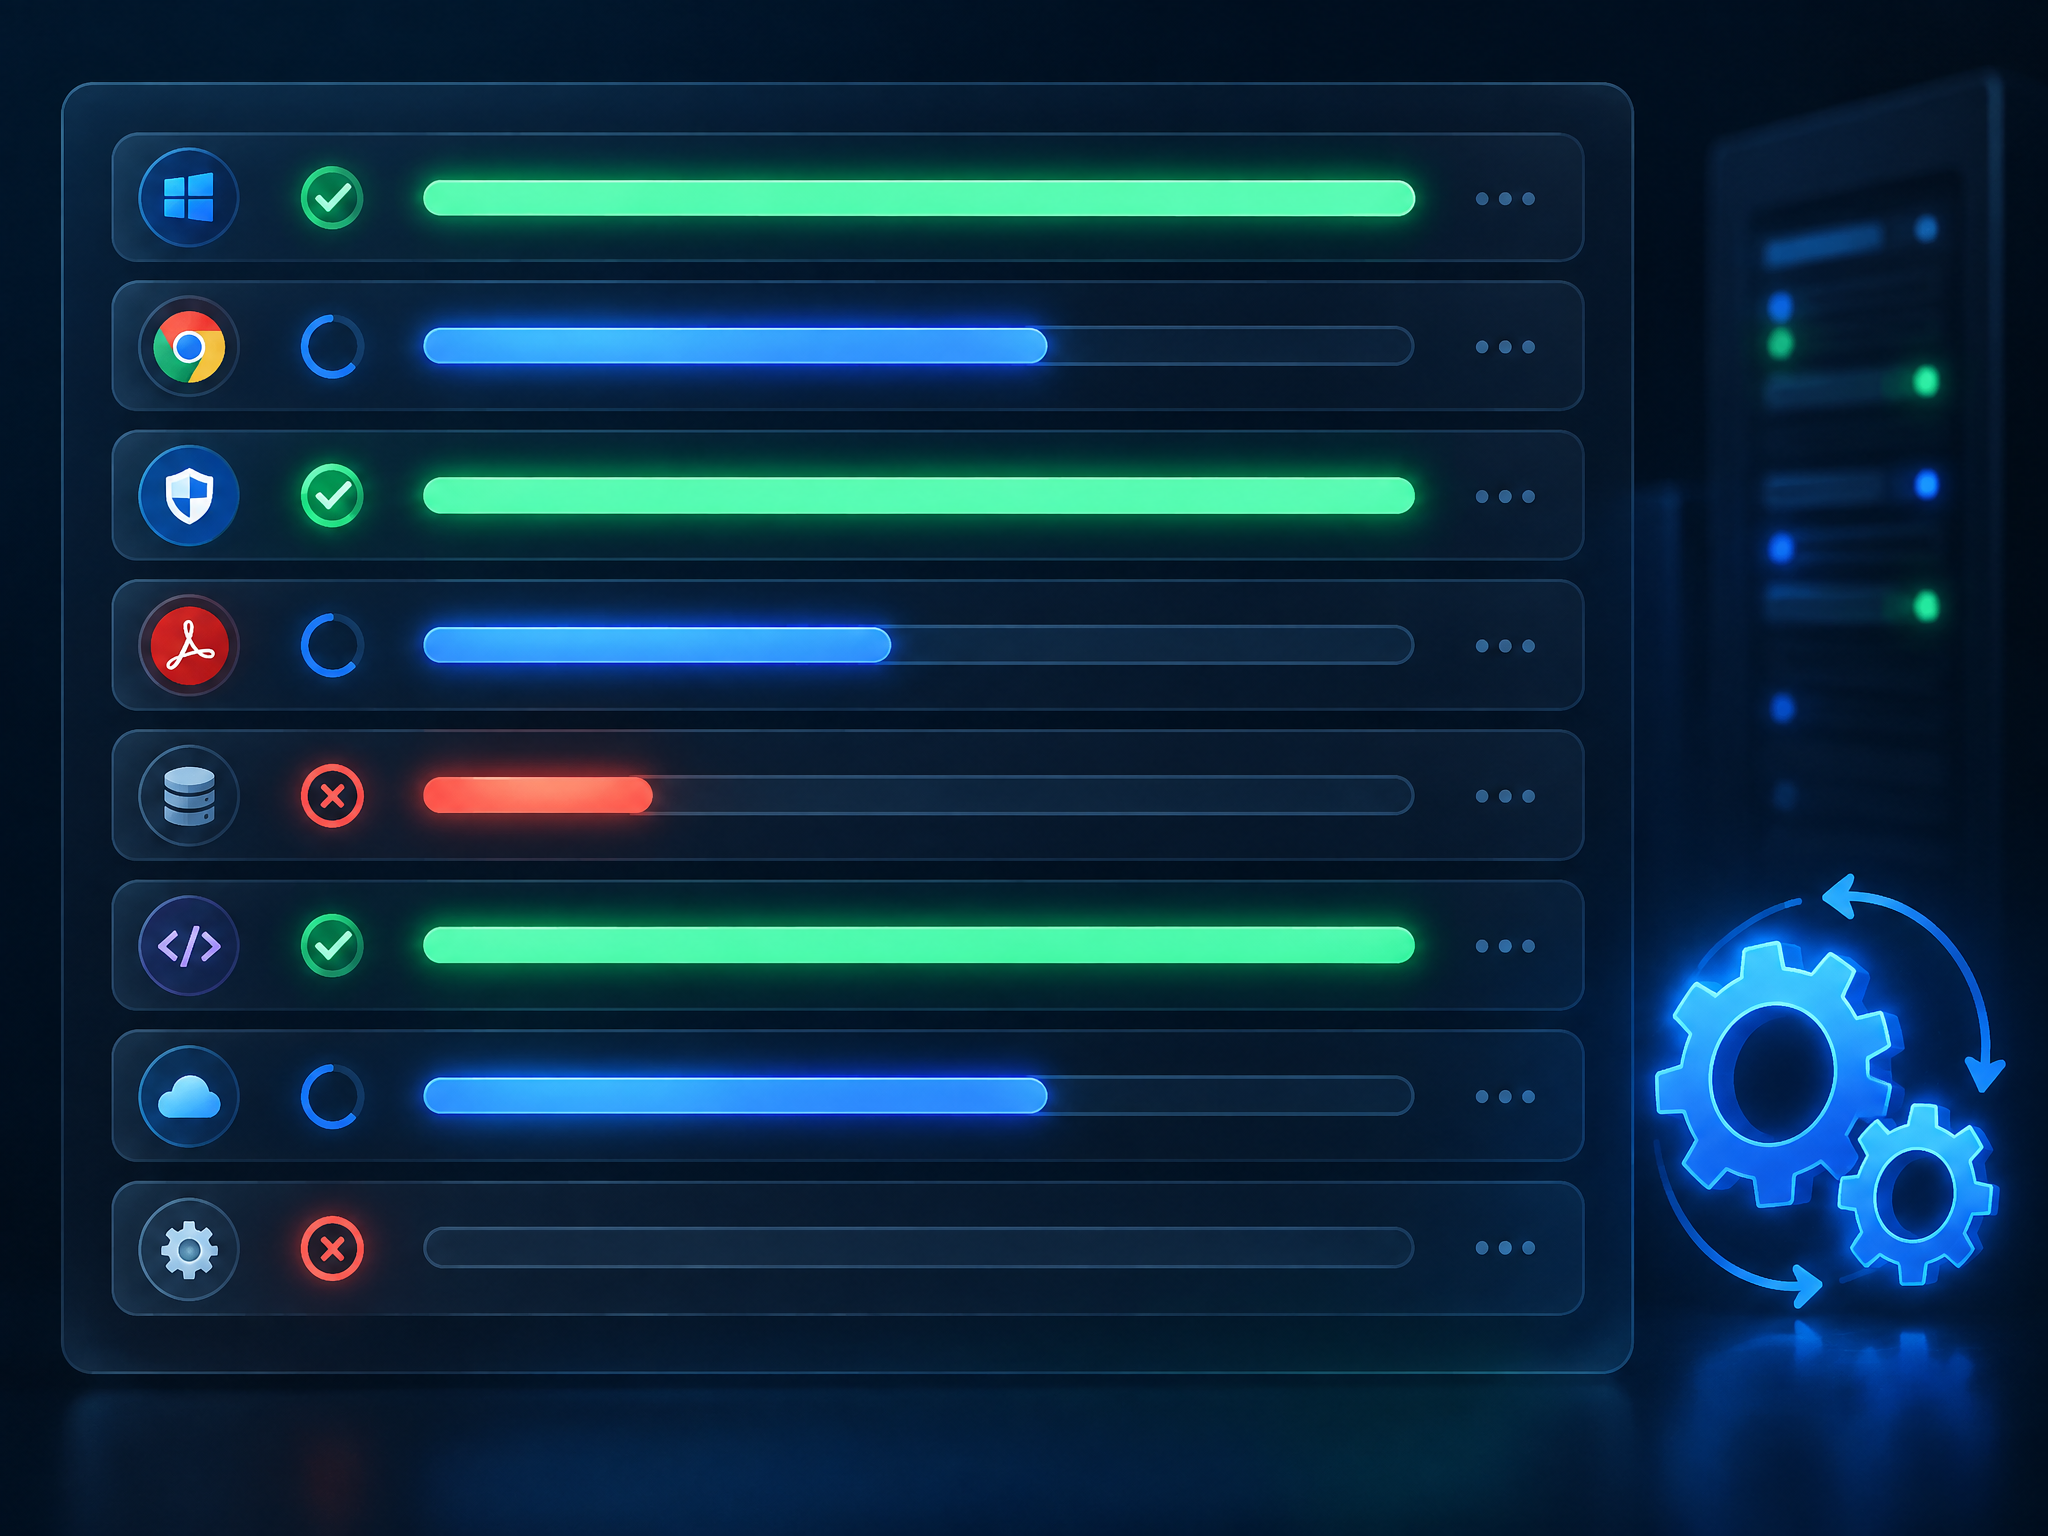
Keep every machine patched and consistent
Track outstanding updates across the fleet and let automation profiles handle routine work on a schedule. Standardize new machines with reusable build profiles.
- Fleet-wide patch visibility
- Scheduled automation profiles
- Reusable build profiles for provisioning
- Consistency across every client site
Manage every client from one place
Each client gets its own isolated organization. Give technicians and clients the right level of access, and read fleet health per organization at a glance.
- Multi-tenant, per-client isolation
- Owner, admin, technician & client roles
- Per-client health and device inventory
- Tickets and time tracking built in
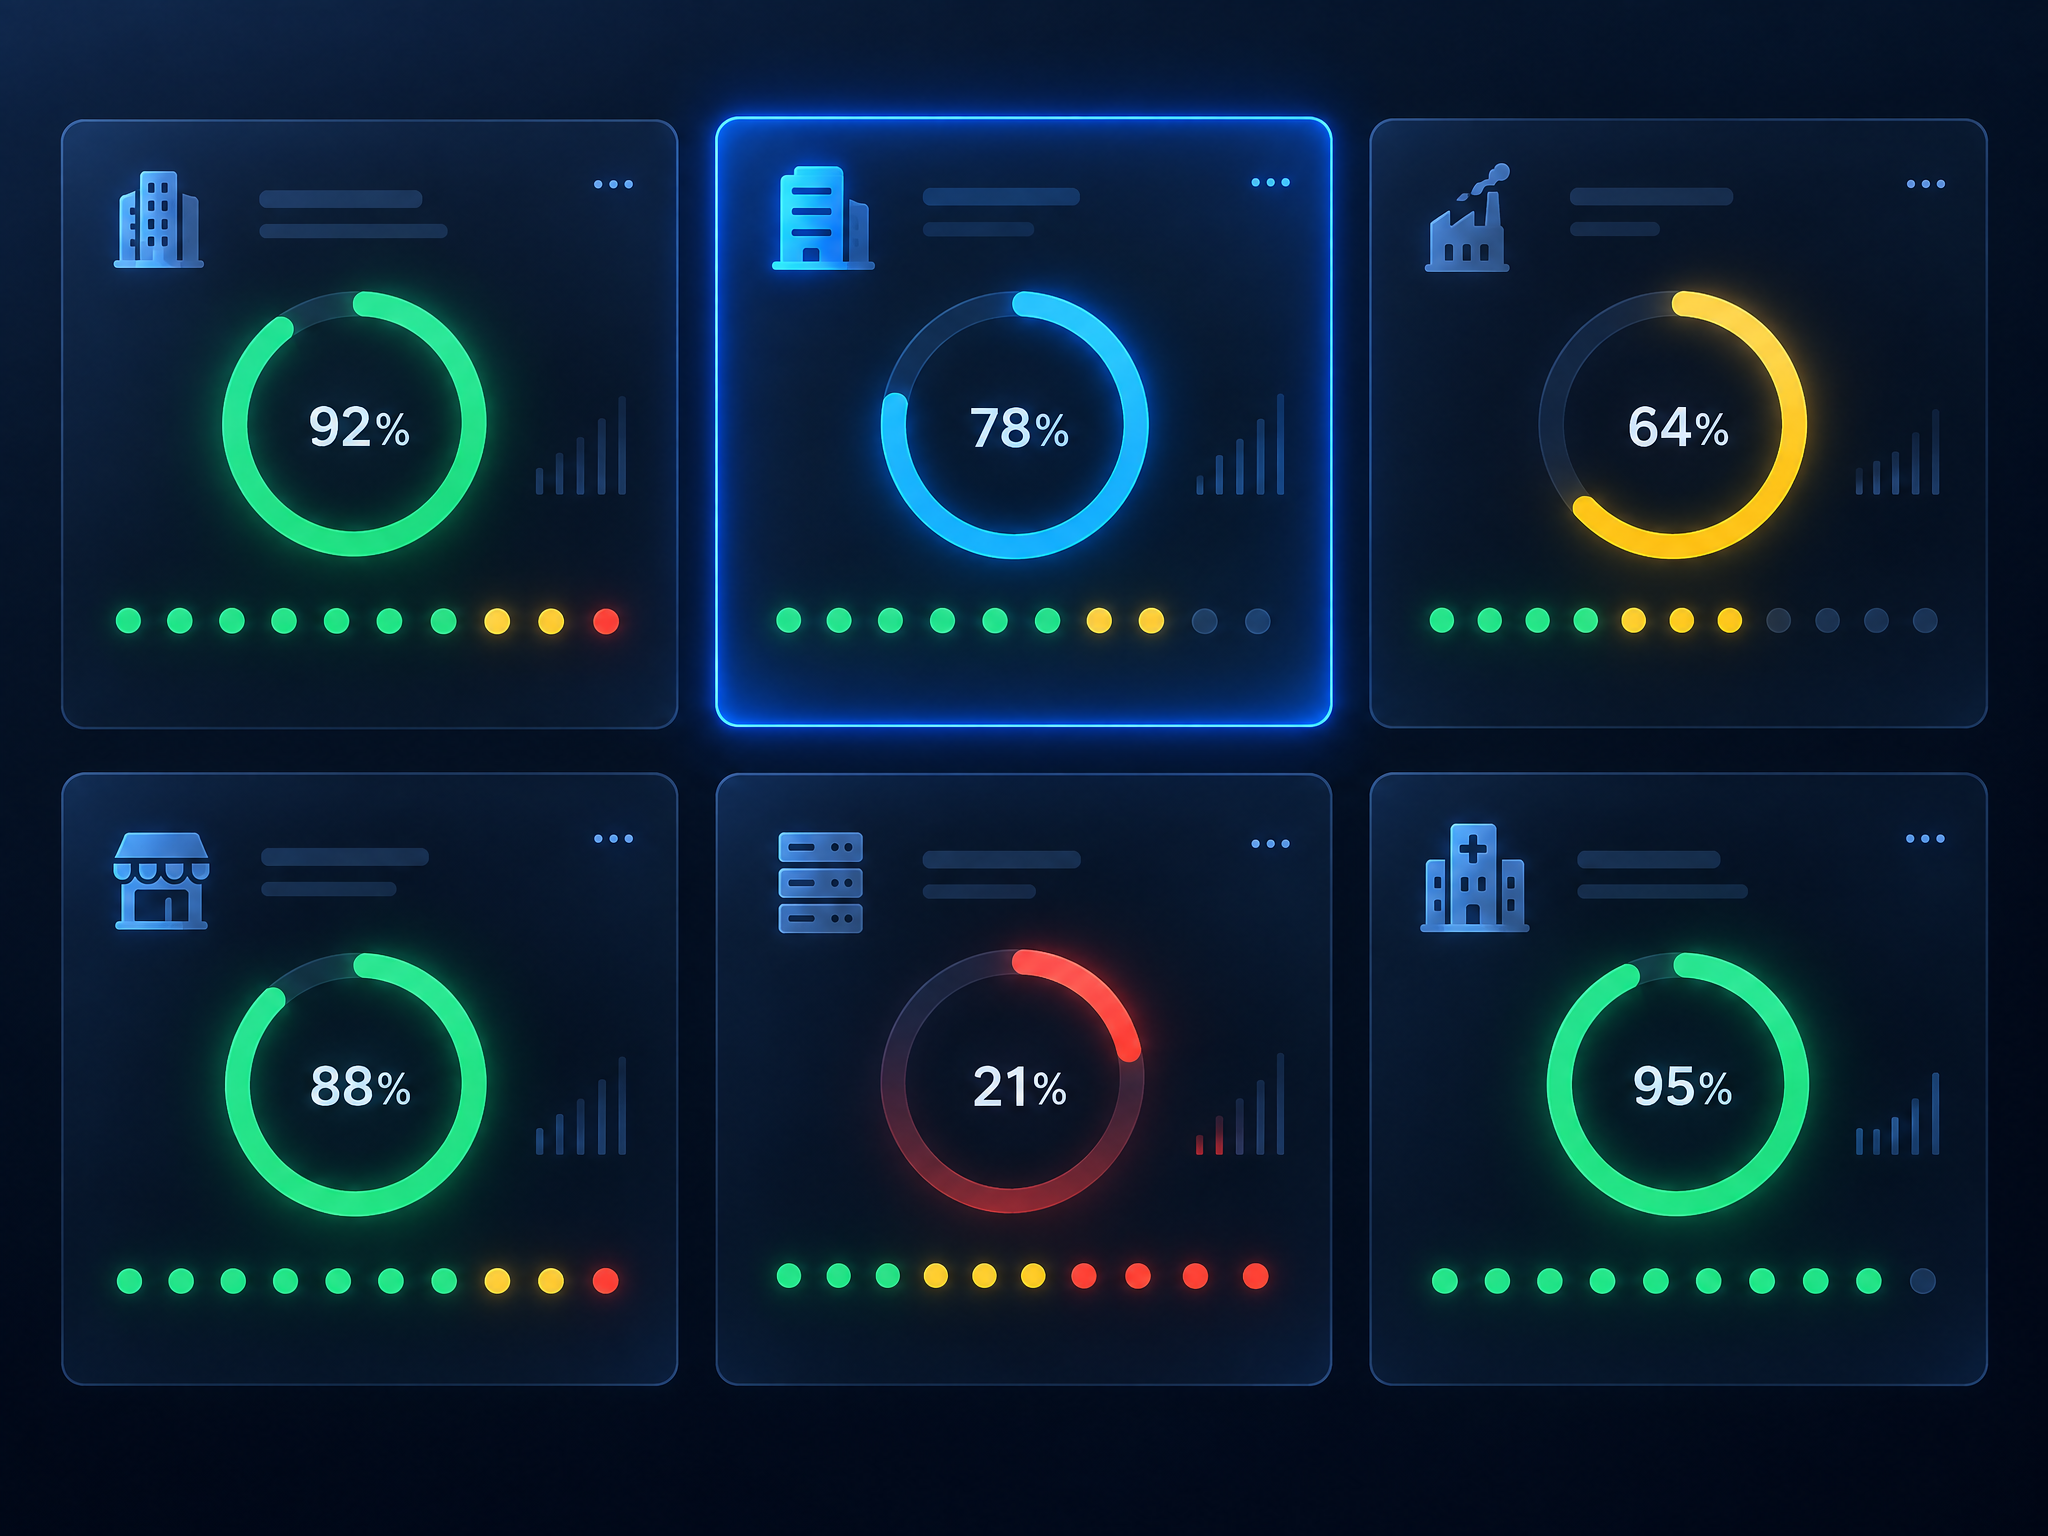
One agent. Every operating system.
Deploy a single lightweight agent to Windows, Linux and macOS with a one-line install script. Agents check in securely and update themselves — so onboarding a new machine takes minutes, not hours.
- One-line install scripts per platform
- Self-updating agents in the field
- Secure check-in to your Topplo console
- Separate network agents for SNMP polling

Everything you need to run IT operations
Fifteen integrated modules, one login. No add-ons to bolt on.
Unified Dashboard
Fleet health at a glance across every client.
Endpoint Devices
CPU, memory, disk, services and software inventory.
Network Devices
SNMP v1/v2c/v3 monitoring for switches & routers.
Network Map
Auto-built topology with interface-level traffic.
Patch Management
Track and roll out updates across the fleet.
Automation
Scheduled profiles that run routine work for you.
Build Profiles
Standardize how new machines get provisioned.
Client Management
Multi-tenant organizations, isolated per client.
Tickets
Track issues and log time against each device.
Alert Rules
Threshold-based alerting on the metrics you choose.
Fleet Alerts
Roll-up health signals across the whole fleet.
Alert Cooldowns
Suppress noise so real issues stand out.
Maintenance Windows
Pause alerts during planned work.
Team & Roles
Owner, admin, technician and client access.
Agent Scripts
One-line install for Windows, Linux and macOS.
Up and running in three steps
From zero to full visibility without a lengthy rollout.
Deploy the agent
Run a one-line install script on each machine, and add your network devices for SNMP polling.
Watch it populate
Devices, metrics and a live network map appear automatically as agents check in.
Automate & resolve
Set alert rules, schedule automation, patch the fleet and work tickets — all in one console.
Ready to unify your IT operations?
Create your Topplo workspace and connect your first devices in minutes.